
Key takeaways
- Cash-on-cash return compares annual pre-tax cash flow with the actual cash invested in a rental property.
- The basic formula is annual pre-tax cash flow divided by total cash invested.
- Financing can significantly affect cash-on-cash return because debt changes both the investor's initial cash investment and annual cash flow.
- Cash-on-cash return measures cash yield, not total investment return, appreciation, equity growth, or taxable income.
- The metric is most useful when investors calculate cash invested and annual cash flow consistently across properties.
On this page
- What Is Cash-on-Cash Return?
- How Cash Becomes Cash-on-Cash Return
- Cash-on-Cash Return Formula
- Cash-on-Cash Return Example
- What Counts as Cash Invested?
- How Financing Affects Cash-on-Cash Return
- Cash-on-Cash Return vs Cap Rate
- Cash-on-Cash Return vs ROI
- Cash-on-Cash Return vs NOI
- Cash-on-Cash Return vs Cash Flow
- What Is a Good Cash-on-Cash Return?
- When Cash-on-Cash Return Can Be Misleading
- How to Improve Cash-on-Cash Return
- Using Cash-on-Cash Return Across a Rental Portfolio
- Cash-on-Cash Return for an All-Cash Purchase
- How PropioLedger Helps Track the Numbers Behind Cash-on-Cash Return
- Educational Disclaimer
- Frequently Asked Questions
What Is Cash-on-Cash Return?
Cash-on-cash return measures the annual cash flow a rental property produces relative to the amount of cash the investor has actually put into the investment.
The basic formula is Cash-on-Cash Return = Annual Pre-Tax Cash Flow ÷ Total Cash Invested × 100.
For example, if an investor puts $100,000 of cash into a rental property and the property produces $8,000 of annual pre-tax cash flow, the cash-on-cash return is 8.0%.
Cash-on-cash return is typically expressed as an annual percentage. Investors use it to compare potential rental investments, evaluate how efficiently invested cash is producing cash flow, understand the effect of financing, compare actual performance with expectations, and review whether additional cash invested in a property is producing an adequate return.
Cash-on-cash return is not the same as cap rate, total ROI, appreciation, taxable income, or accounting net income. Those metrics answer related but different questions.
Cash-on-Cash Return = Annual Pre-Tax Cash Flow ÷ Total Cash Invested × 100
| Calculation | Amount |
|---|---|
| Annual pre-tax cash flow | $8,000 |
| Total cash invested | $100,000 |
| Cash-on-cash return | 8.0% |
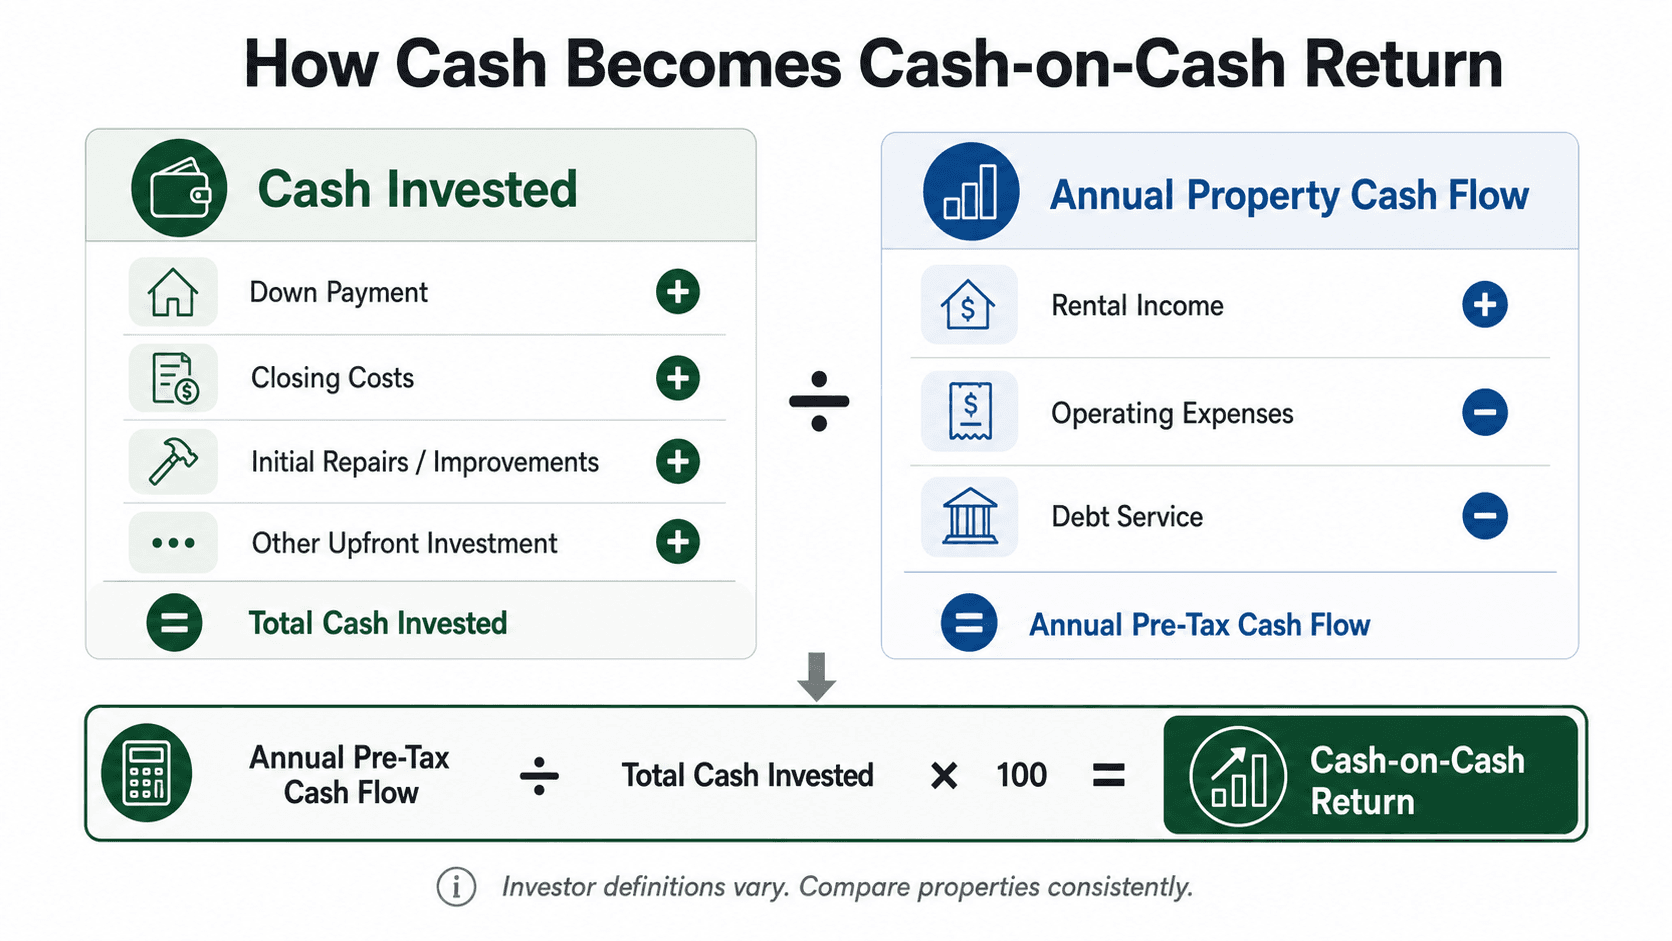
How Cash Becomes Cash-on-Cash Return
Cash-on-cash return connects two parts of the investment: the cash invested to acquire or improve the property and the annual pre-tax cash flow the property produces.
Investor definitions can vary. Some investors include only acquisition cash, while others update invested cash when major additional capital is contributed later. The important thing is to compare properties consistently.
Investor definitions vary. Compare properties consistently.
Cash-on-Cash Return Formula
The cash-on-cash return formula is Annual Pre-Tax Cash Flow divided by Total Cash Invested, multiplied by 100.
Annual pre-tax cash flow generally starts with property income, subtracts operating expenses, and then subtracts debt service. Cash flow calculations can vary depending on what the investor includes, so the inputs should be clear before comparing properties.
Total cash invested commonly includes cash actually contributed to acquire and prepare the property, such as the down payment, buyer closing costs, initial repairs, initial renovations, immediate capital improvements, and other acquisition-related cash contributions.
Cash-on-Cash Return = Annual Pre-Tax Cash Flow ÷ Total Cash Invested × 100
Cash-on-Cash Return Example
This simplified rental property cash-on-cash return example uses a fictional Oak Street Rental purchased for $350,000. The investor makes a 25% down payment, pays closing costs, and completes initial repairs before renting the property.
This is a simplified educational example. Actual acquisition costs, operating costs, financing terms, taxes, reserves, and capital improvements can change the result.
| Item | Amount |
|---|---|
| Purchase price | $350,000 |
| 25% down payment | $87,500 |
| Closing costs | $8,500 |
| Initial repairs | $14,000 |
| Total cash invested | $110,000 |
| Gross rental income | $36,000 |
| Vacancy / credit loss | ($1,800) |
| Effective rental income | $34,200 |
| Operating expenses | ($12,200) |
| NOI | $22,000 |
| Annual debt service | ($13,200) |
| Annual pre-tax cash flow | $8,800 |
| Cash-on-cash return | 8.0% |
$8,800 ÷ $110,000 × 100 = 8.0%.
The investor has $110,000 of cash invested and the property produces $8,800 of annual pre-tax cash flow, so the investment is producing an 8% annual cash yield based on those assumptions.
That does not mean the total investment return is 8%. Appreciation, principal paydown, tax treatment, selling costs, and future capital needs are separate from this cash-on-cash return calculation.
What Counts as Cash Invested?
The cash invested part of the calculation deserves attention because it can materially change the result.
Many investors begin with cash contributed at acquisition and preparation. Others update the invested-cash basis when meaningful additional capital is contributed later. Neither approach should be treated as universally mandatory for every analysis.
| Item | Usually Considered? | Why |
|---|---|---|
| Down payment | Yes | It is cash contributed to acquire the rental property. |
| Closing costs paid by buyer | Often | They are acquisition costs paid in cash. |
| Initial repairs required before renting | Often | They are cash costs needed to make the property rentable. |
| Initial renovations | Often | They may be part of the upfront investment plan. |
| Immediate capital improvements | Often | They can represent additional cash required before or soon after acquisition. |
| Loan fees paid in cash | Often | They may be direct cash financing costs at purchase. |
| Inspection/appraisal costs | Sometimes | Some investors include them when measuring total acquisition cash. |
| Operating reserves | Sometimes | Some investors include required or committed operating reserves when measuring total cash committed to the investment, while others exclude unused reserves because the cash has not been spent. |
| Later capital contributions | Sometimes | Owners may update cash invested when significant additional capital is contributed. |
Initial cash invested and additional cash invested later are related but not identical. An investor evaluating an acquisition may focus on upfront cash needed to buy and prepare the property. An owner reviewing actual long-term performance may choose to update cash invested when major capital is added later.
How Financing Affects Cash-on-Cash Return
Financing is one reason real estate cash on cash return can differ sharply from cap rate. Debt changes both the amount of cash invested and the annual cash flow remaining after debt service.
Leverage can increase or decrease cash-on-cash return. Using less cash does not automatically produce a better investment because higher debt can increase risk and reduce annual cash flow.
| Metric | 50% Down | 25% Down |
|---|---|---|
| Purchase price | $350,000 | $350,000 |
| Down payment | $175,000 | $87,500 |
| Other initial cash | $22,500 | $22,500 |
| Total cash invested | $197,500 | $110,000 |
| NOI | $22,000 | $22,000 |
| Annual debt service | ($8,400) | ($13,200) |
| Annual cash flow | $13,600 | $8,800 |
| Cash-on-cash return | 6.9% | 8.0% |
In this simplified example, the 25% down scenario has a higher percentage return because the denominator is smaller, even though annual cash flow is lower. That does not automatically make it better. More leverage can reduce cash invested, but it also increases debt service, reduces margin for error, and can increase financial risk.
Cash-on-Cash Return vs Cap Rate
Cap rate generally evaluates property operating performance relative to property value or purchase price before financing. Cash-on-cash return evaluates cash flow relative to the investor's actual cash invested and therefore reflects financing.
Two investors could purchase the same property at the same price and therefore have the same cap rate, but have different cash-on-cash returns because they use different financing.
| Metric | Cash-on-Cash Return | Cap Rate |
|---|---|---|
| Measures | Annual cash flow relative to cash invested | NOI relative to property value or purchase price |
| Includes financing? | Yes, through debt service and cash invested | Generally no |
| Uses cash invested? | Yes | No |
| Uses NOI? | Indirectly, often as a starting point before debt service | Yes |
| Primary purpose | Evaluate cash yield on invested cash | Compare property operating yield |
| Best used for | Financed investor-specific return review | Property comparison before financing |
Cash-on-Cash Return vs ROI
Cash-on-cash return is narrower than total return on investment. It generally focuses on annual cash flow, while ROI may include other sources of return depending on how the calculation is defined.
ROI may consider appreciation, principal paydown, sale proceeds, capital improvements, and total gain over the investment period. Neither metric is inherently better; they answer different questions.
| Topic | Cash-on-Cash Return | ROI |
|---|---|---|
| Typical focus | Annual cash flow yield | Broader investment return |
| Time period | Usually annual | Can be annual or multi-year |
| Appreciation | Usually excluded | May be included |
| Principal paydown | Usually excluded | May be included |
| Best question | How much cash flow is my cash producing? | What total return is the investment producing? |
Cash-on-Cash Return vs NOI
NOI measures property operating performance before debt service and certain non-operating items. Cash-on-cash return uses cash flow after debt service relative to invested cash.
A simple flow is Rental Income minus Operating Expenses equals NOI. NOI minus Debt Service equals Pre-Tax Cash Flow. Pre-Tax Cash Flow divided by Cash Invested equals Cash-on-Cash Return.
Related Guides
Rental Property NOI GuideCash-on-Cash Return vs Cash Flow
Cash flow is a dollar amount. Cash-on-cash return converts that cash flow into a percentage of invested cash.
Property A may produce $10,000 of annual cash flow while Property B produces $8,000. At first, Property A looks better. But if Property A required $200,000 of cash invested, its cash-on-cash return is 5.0%. If Property B required $80,000 of cash invested, its cash-on-cash return is 10.0%.
Investors should look at both dollars and percentages. A higher percentage return with very low dollar cash flow may not meet an owner's goals, while a lower percentage return may still produce meaningful cash dollars.
| Property | Annual Cash Flow | Cash Invested | Cash-on-Cash Return |
|---|---|---|---|
| Property A | $10,000 | $200,000 | 5.0% |
| Property B | $8,000 | $80,000 | 10.0% |
What Is a Good Cash-on-Cash Return?
There is no universally good cash-on-cash return for every rental property. A "good" cash-on-cash return is one that appropriately compensates the investor for the property's risk, effort, financing structure, and alternative uses of the invested cash.
The appropriate return depends on market, property type, financing costs, interest rates, investment risk, expected appreciation, investor objectives, liquidity, renovation needs, management requirements, and alternative investment opportunities.
Many investors establish their own target return before evaluating deals. Comparing properties with the same assumptions is often more useful than chasing an arbitrary percentage.
When Cash-on-Cash Return Can Be Misleading
Cash-on-cash return is useful, but it is not a complete investment analysis. The result can be misleading when assumptions are incomplete, inconsistent, or based on an unusually strong or weak year.
| Limitation | Why It Matters |
|---|---|
| Ignoring appreciation | The metric excludes potential market value changes. |
| Ignoring principal paydown | Debt reduction can build equity without appearing as cash flow. |
| Ignoring future capital expenditures | Large replacements can reduce actual cash returns. |
| Using unrealistic rent assumptions | Overstated rent can inflate projected cash flow. |
| Underestimating vacancy | Vacancy reduces effective income and cash flow. |
| Underestimating maintenance | Weak expense assumptions can overstate return. |
| Excluding acquisition costs inconsistently | Different denominators distort property comparisons. |
| Ignoring large future repairs | Deferred repairs may require major additional cash later. |
| Comparing different calculation methods | The percentage may reflect methodology instead of performance. |
| Focusing on percentage while ignoring dollars | A high percentage can still produce too little cash. |
| Using one unusual year as representative | One-time income or expense events can distort the result. |
How to Improve Cash-on-Cash Return
Cash-on-cash return improves by changing one or more parts of the formula: increasing sustainable income, reducing avoidable operating expenses, improving occupancy, improving rent collection, reducing financing costs where realistically possible, avoiding unnecessary upfront costs, or making capital improvements that produce sufficient economic benefit.
That does not mean landlords should simply raise rent. Any action should make economic sense, comply with leases and applicable laws, and account for renter retention, vacancy risk, property condition, and long-term value.
Using Cash-on-Cash Return Across a Rental Portfolio
Portfolio averages can hide major differences between individual properties. A portfolio may produce healthy total cash flow while one property is producing a much weaker cash yield on invested capital.
Property-level tracking helps owners compare cash invested, income, expenses, NOI, debt service, cash flow, and return metrics without letting stronger properties mask weaker ones.
| Property | Cash Invested | Annual Cash Flow | Cash-on-Cash Return |
|---|---|---|---|
| Property A | $120,000 | $9,600 | 8.0% |
| Property B | $75,000 | $7,500 | 10.0% |
| Property C | $180,000 | $5,400 | 3.0% |
In this example, Property C still produces positive annual cash flow, but its cash yield on invested capital is substantially weaker than the other properties. That difference can be hard to see when reviewing only portfolio totals.
Cash-on-Cash Return for an All-Cash Purchase
When an investor buys entirely with cash, annual debt service is zero. In that case, cash-on-cash return may resemble cap rate, but the metrics are still conceptually different.
Cap rate commonly uses annual NOI divided by property value or purchase price. Cash-on-cash return uses annual pre-tax cash flow divided by cash invested. Cash invested may include closing costs, initial repairs, renovations, or other acquisition costs, while cap rate often uses only property value or purchase price.
| Metric | Calculation | Result |
|---|---|---|
| Purchase price | $350,000 | $350,000 |
| Additional cash invested | $25,000 | $25,000 |
| Annual NOI | $22,000 | $22,000 |
| Cap rate | $22,000 ÷ $350,000 | 6.3% |
| Cash-on-cash return | $22,000 ÷ $375,000 | 5.9% |
Because this simplified example has no debt service, annual pre-tax cash flow equals the $22,000 NOI. That equality does not necessarily hold when other non-operating cash items are present.
How PropioLedger Helps Track the Numbers Behind Cash-on-Cash Return
PropioLedger helps landlords organize the underlying property-level information used when evaluating investment performance, including rental income, other property income, expenses, property-level cash flow, NOI, financing-related cash outflows where recorded, profitability, and reporting.
Keeping these records organized makes it easier to evaluate property performance and apply return calculations consistently. PropioLedger helps keep the underlying rental income, expenses, cash flow, NOI, and property-level records connected so owners can review the numbers used in investment-performance analysis.
Understand What Your Rental Properties Are Really Producing
PropioLedger helps landlords organize rental income, expenses, cash flow, NOI, and property-level financial performance so they can make more informed decisions across their portfolio.
Educational Disclaimer
This guide is for general educational purposes and is not tax, accounting, legal, financial, or investment advice. Cash-on-cash return calculations, income classification, expense classification, acquisition-cost treatment, capital expenditure treatment, financing costs, tax treatment, and investment analysis depend on individual circumstances, reporting purpose, accounting method, applicable rules, and professional judgment. Landlords and investors should consult a qualified accountant, tax professional, attorney, financial advisor, or investment professional for guidance specific to their situation.