
Reports
Cashflow Report
Understand property-level income, expenses, net cashflow, monthly totals, and property cashflow comparisons.
Overview
The Cashflow Report helps landlords understand how money moves through a rental portfolio by tracking income, expenses, and net cashflow for the selected period.
Use this report when you want to review total money received, paid expenses, optional planned expenses, monthly cashflow trends, and which properties are generating positive or negative cashflow.
When To Use It
The Cashflow Report is useful for monthly financial reviews, budget planning, expense monitoring, property comparisons, and portfolio cashflow analysis.
It answers questions such as how much money came in, how much was spent, what the net cashflow was, and which properties are producing or consuming cash.
Available Date Ranges
- Year To Date.
- Prior calendar years that have payment or expense data.
Summary Metrics
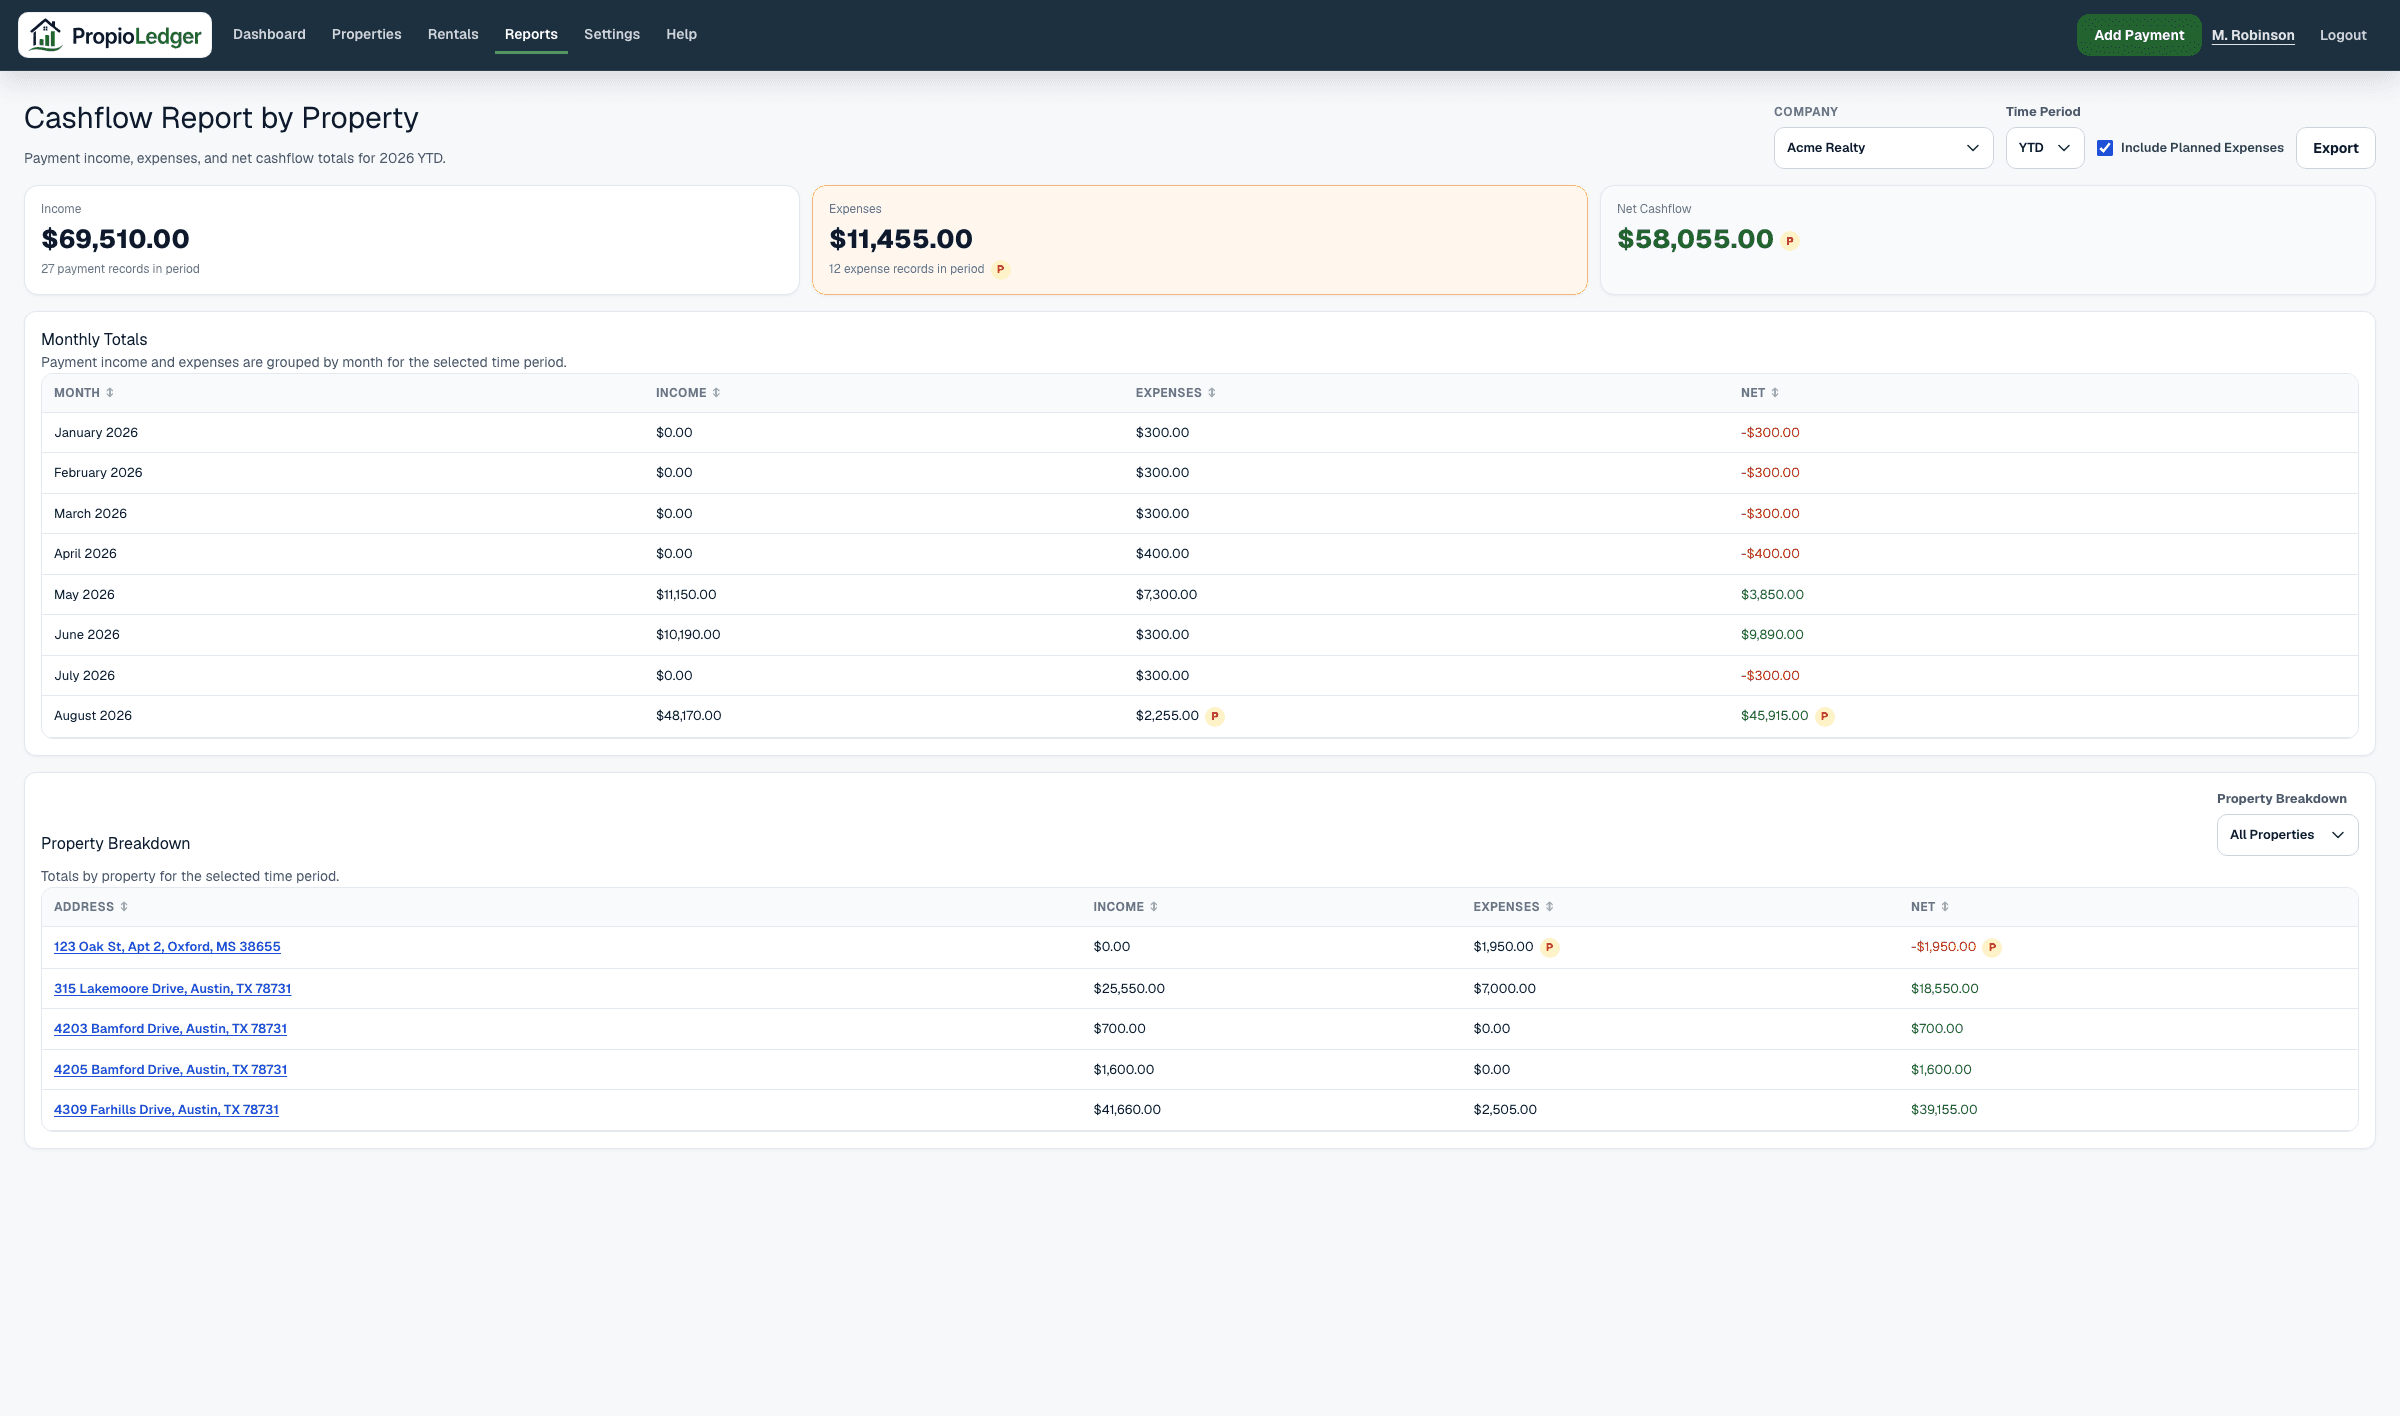
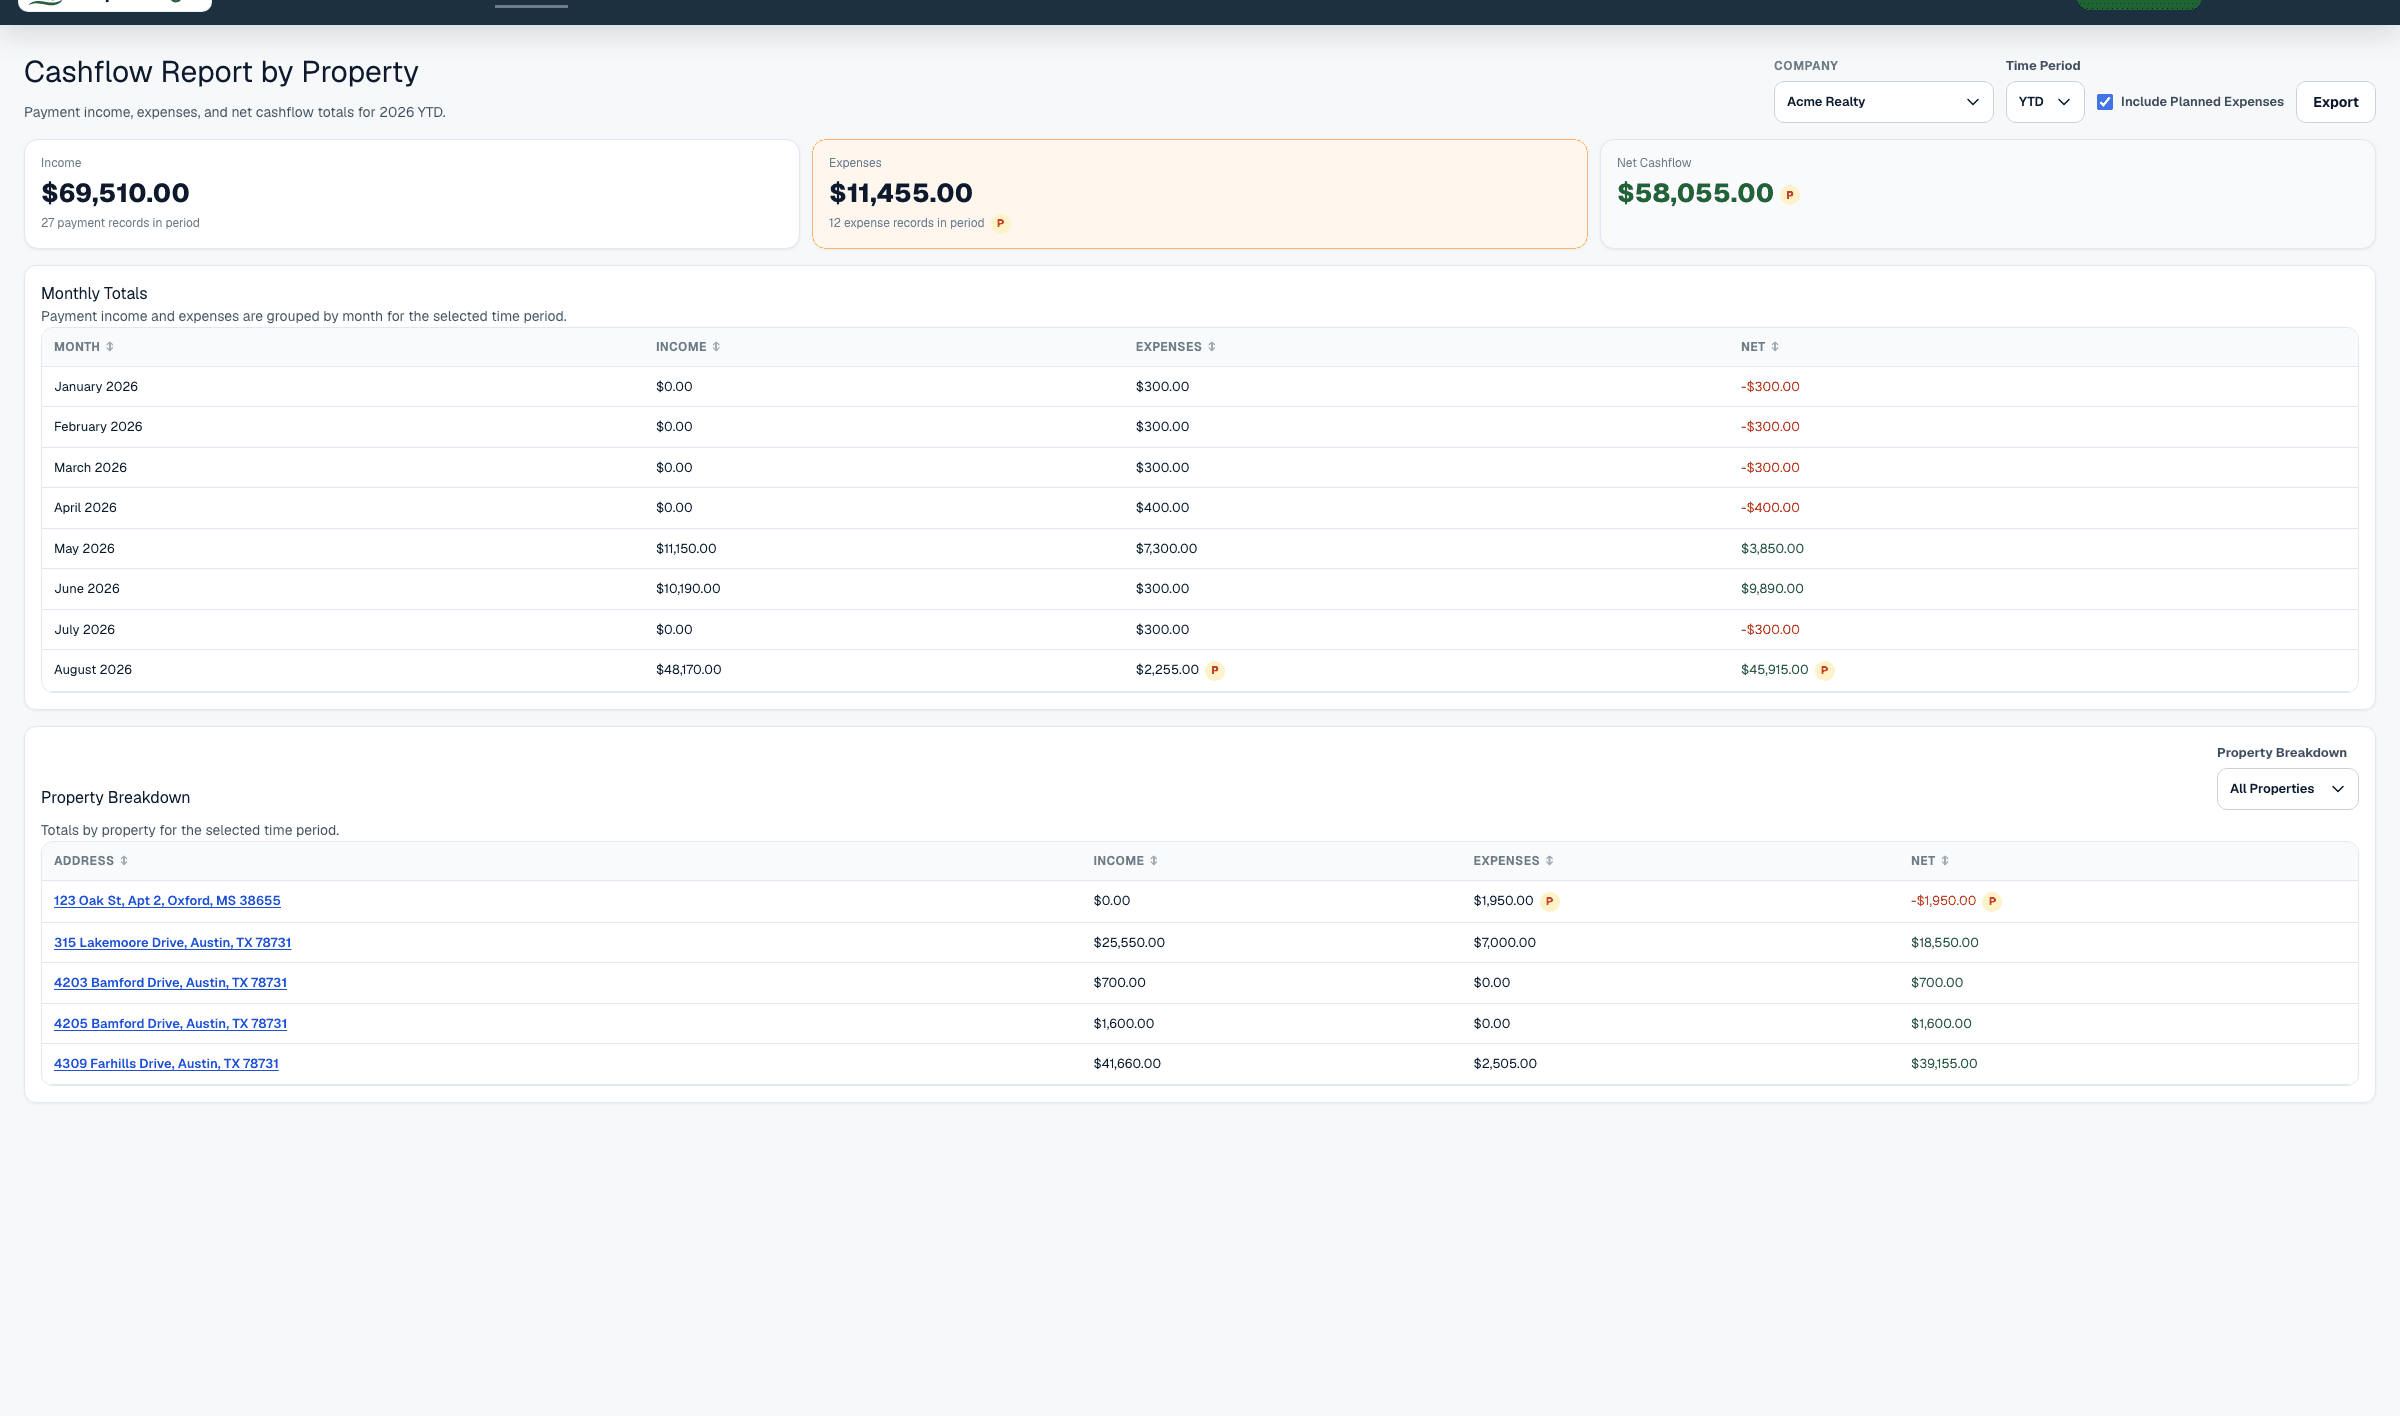
Income is the sum of net payment transaction amounts whose payment date or payment month falls inside the selected period. Cashflow income includes all payment types, including rental revenue, deposits, reimbursements, and other collections.
Expenses are the sum of paid property expense amounts whose date falls inside the selected period, plus planned expenses when Include Planned Expenses is turned on.
Net Cashflow is Income minus Expenses for the selected period.
Payment Count is the number of payment transactions included in the selected period. Expense Count is the number of expense rows included in the selected period.
Planned Expenses
Use Include Planned Expenses when you want expected future costs to affect Cashflow Report totals. Leave it off when you want the report to show paid activity only.
Rows and metrics can show a P marker when planned expenses exist for that month or property. The marker is an awareness cue even when planned expenses are not included in the current totals.
Canceled expenses are excluded from Cashflow Report totals.
Monthly Totals
The Monthly Totals section groups income, expenses, and net cashflow by month. Use it to spot seasonal changes, unexpected expense spikes, or months where cashflow tightened.
Monthly Net is monthly income minus monthly expenses. Positive values indicate the month brought in more cash than it spent, while negative values indicate expenses exceeded income for that month.
Property Breakdown
The Property Breakdown section compares properties side by side. Each row shows address, income, expenses, and net cashflow for the selected period.
Use the Property Breakdown filter to view all properties, only negative cashflow rows, or only positive cashflow rows.
Formula
Net payment amount = payment amount - refunded amount, never below zero.
Monthly Net = monthly income - monthly expenses.
Property Net = property income - property expenses.
Total Net Cashflow = total income - total expenses.
Data Sources
Income comes from payment transactions after refunds. Unlike the Performance Report, the Cashflow Report includes all payment types because it is focused on money movement rather than rental revenue only.
Expenses come from paid property expense rows whose date falls inside the selected period, plus planned rows when planned expenses are included.
Property rows are grouped by the property connected to each payment or expense record and are limited to properties visible in the current company scope.
Included Records
- Net payment transactions dated inside the selected period.
- Rental revenue payments, deposits, reimbursements, and other payment types.
- Paid property expenses with a date inside the selected period.
- Planned property expenses with a date inside the selected period when Include Planned Expenses is turned on.
- Properties with payment or expense activity in the selected period.
Excluded Records
- Unpaid ledger charges that have not been collected as payments.
- Planned expenses when Include Planned Expenses is turned off.
- Canceled expenses.
- Future scheduled recurring expense occurrences that have not become property expense rows.
- Property expenses whose date falls outside the selected period.
- Payments or expenses outside the current company scope.
Cashflow Vs Profitability
Cashflow and profitability are related, but they are not the same report view. Cashflow measures money in and money out during the selected period.
The Property Profitability Report adds more operating-performance context by separating rental income, expenses, net operating income, and net cashflow. For a complete property review, use both reports together.
Common Use Cases
- Review Total Net Cashflow to understand whether the portfolio produced positive cashflow.
- Use Monthly Totals to find months with unusually high expenses or lower income.
- Use Property Breakdown to identify strong performers and properties that need attention.
- Use the negative-only filter to focus on properties where expenses exceeded income.
Things To Watch For
- Security deposits, pet deposits, reimbursements, and other collections are included in Income because the Cashflow Report tracks cash movement.
- Income can differ from Performance Report Collected Revenue because the Performance Report counts only rental-revenue payment types.
- Expenses appear when their date is inside the selected period.
- Planned expenses are clearly marked with P indicators where they exist.
- Scheduled recurring expenses are not counted as paid expenses until they become property expense records.
Export Options
The Cashflow Report supports CSV download, Excel download, and printable PDF-style browser export.
Related Guides
Common Questions
- What income is included in the Cashflow Report?All payment transaction types are included, including rent, deposits, reimbursements, and other collections.
- Does the Cashflow Report include expenses?Yes. It includes paid property expenses whose date falls inside the selected period, and planned expenses when Include Planned Expenses is turned on.
- How is Net Cashflow calculated?Net Cashflow equals Income minus Expenses.
- Why does cashflow differ from profitability?Cashflow measures money movement, while profitability separates operating income and expenses for performance analysis.
- Can I compare properties using this report?Yes. The Property Breakdown section provides property-level cashflow comparisons and filters for positive or negative rows.
Last Updated
August 2026