Reports
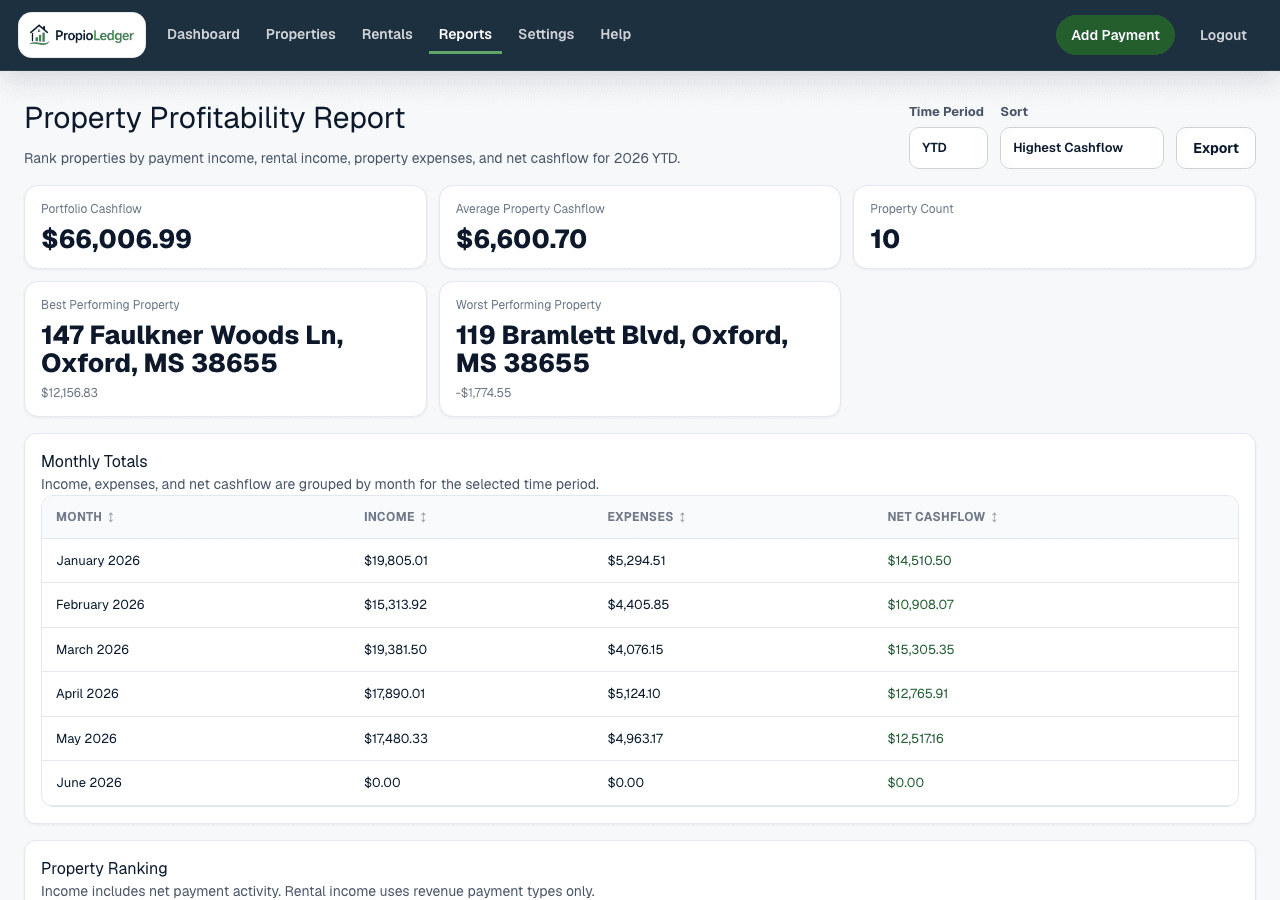
Property Profitability Report
Compare properties by income, rental income, expenses, net operating income, and net cashflow.
Overview
The Property Profitability Report helps landlords rank properties by income, expenses, net operating income, and net cashflow for the selected period.
Use this report when you want to compare properties side by side, identify strong performers, find properties with high expenses, and understand which rentals are contributing most to portfolio cashflow.
When To Use It
The Property Profitability Report is useful for portfolio reviews, investment planning, expense follow-up, and deciding which properties deserve more attention.
It answers questions such as which properties produce the most cashflow, which properties are underperforming, which properties have the highest expenses, and whether cashflow differs from operating income.
Available Date Ranges
- Year To Date.
- Prior calendar years that have payment or expense data.
Sort Options
Highest Cashflow ranks properties from strongest Net Cashflow to weakest.
Lowest Cashflow ranks properties from weakest Net Cashflow to strongest, which is useful when looking for underperformers.
Highest Income ranks properties by total income collected during the selected period.
Highest Expense ranks properties by posted property expenses during the selected period.
Summary Metrics
Portfolio Cashflow is the sum of property Net Cashflow across all property rows in the selected period.
Average Property Cashflow is Portfolio Cashflow divided by the number of property rows. It is zero when no property rows are included.
Property Count is the number of properties with payment or expense activity included in the report.
Best Property is the property row with the highest Net Cashflow during the selected period.
Worst Property is the property row with the lowest Net Cashflow during the selected period.
Monthly Totals
The Monthly Totals section groups income, expenses, and net cashflow by month. Use it to identify seasonal changes, expense spikes, and months where cashflow tightened.
Monthly Net Cashflow is monthly income minus monthly expenses.
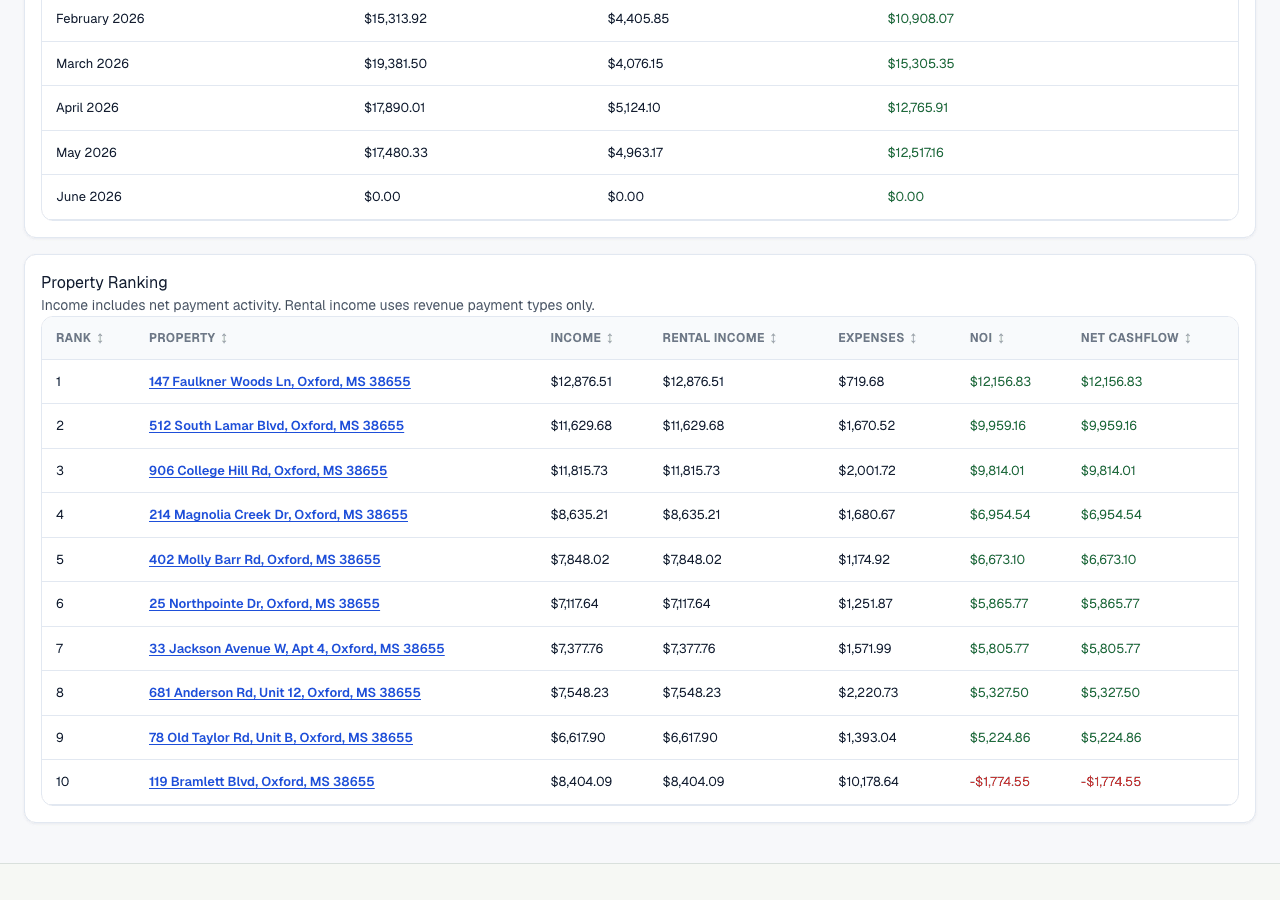
Property Ranking
The Property Ranking section compares properties side by side. Each row includes rank, property, income, rental income, operating expenses, cash outflows, net operating income, and net cashflow.
Use this section to see how each property contributes to portfolio performance and to understand whether a property is strong because of rental income, other collections, lower operating expenses, lower cash outflows, or a combination of those factors.
Understanding The Metrics
Income is the sum of all net payment transaction amounts in the selected period. It includes rental revenue, deposits, reimbursements, and other collections.
Rental Income is the sum of net payment transaction amounts whose payment type counts as rental revenue.
Operating Expenses are posted property expense amounts whose paid date falls inside the selected period, excluding Mortgage Principal.
Cash Outflows are all posted property expense amounts whose paid date falls inside the selected period, including Mortgage Principal.
Net Operating Income is Rental Income minus Operating Expenses. It focuses on rental operating performance and excludes non-revenue collections and principal reduction.
Net Cashflow is Income minus Cash Outflows. It focuses on money movement and can differ from Net Operating Income because all income types and all recorded cash outflows are included.
Formula
Income = sum of all net payment transaction amounts in the selected period.
Rental Income = sum of net payment transaction amounts in the selected period whose payment type counts as rental revenue.
Net payment amount = payment amount - refunded amount, never below zero.
Operating Expenses = sum of posted property expenses whose paid date falls inside the selected period, excluding Mortgage Principal.
Cash Outflows = sum of all posted property expenses whose paid date falls inside the selected period.
Net Operating Income = Rental Income - Operating Expenses.
Net Cashflow = Income - Cash Outflows.
Portfolio Cashflow = sum of property Net Cashflow.
Average Property Cashflow = Portfolio Cashflow / property count, or zero when no property rows are included.
Data Sources
Income and Rental Income come from payment transaction records after refunds. Rental Income only includes payment types that count as rental revenue.
Operating Expenses and Cash Outflows come from posted property expense rows whose paid date falls inside the selected period. Mortgage Principal is excluded from Operating Expenses but included in Cash Outflows.
Property rows are grouped by the property connected to each payment or expense record and are limited to properties visible in the current company scope.
Included Records
- Net payment transactions dated inside the selected period.
- Rental revenue payments, deposits, reimbursements, and other collections for Income.
- Rental-revenue payment types for Rental Income.
- Posted property expenses with a paid date inside the selected period.
- Properties with payment or expense activity in the selected period.
Excluded Records
- Unpaid rental ledger charges that have not been collected as payments.
- Security deposits, pet deposits, reimbursements, and other non-revenue collections from Rental Income.
- Future scheduled recurring expense occurrences that have not been posted as property expenses.
- Property expenses whose paid date falls outside the selected period.
- Payments or expenses outside the current company scope.
Net Operating Income Vs Net Cashflow
Net Operating Income measures Rental Income minus Operating Expenses. It is best for reviewing rental operating performance.
Net Cashflow measures total Income minus Cash Outflows. It is best for reviewing actual cash generated by the property during the period.
Both metrics are useful. A property can have strong cashflow because it collected deposits or reimbursements, while Net Operating Income gives a cleaner view of rental revenue compared with expenses.
Common Use Cases
- Sort by Highest Cashflow to identify top-performing properties.
- Sort by Lowest Cashflow to find properties that need attention.
- Sort by Highest Expense to review properties with unusually high costs.
- Compare Income and Rental Income to see where non-revenue collections affect cashflow.
- Review Net Operating Income and Net Cashflow together before making investment or improvement decisions.
Things To Watch For
- Income includes all payment types, but Rental Income includes only payment types treated as rental revenue.
- Expenses appear when they are posted with a paid date in the selected period.
- Scheduled recurring expenses are not included until they become posted property expense records.
- A property with high income can still rank poorly if expenses are also high.
- A property with low Net Operating Income but stronger Net Cashflow may have non-revenue collections affecting cashflow.
Export Options
The Property Profitability Report supports CSV download, Excel download, and printable PDF-style browser export.
Related Guides
Common Questions
- What is Net Operating Income?Net Operating Income is Rental Income minus Operating Expenses.
- What is Net Cashflow?Net Cashflow is total Income minus Cash Outflows.
- Why can Net Operating Income differ from Net Cashflow?Net Operating Income uses rental revenue only, while Net Cashflow includes all income types.
- What does Best Property mean?Best Property is the property with the highest Net Cashflow during the selected period.
- Why should landlords compare properties?Property comparisons help identify strong performers, weak performers, high-expense properties, and opportunities for improvement.
Last Updated
June 2026