Reports
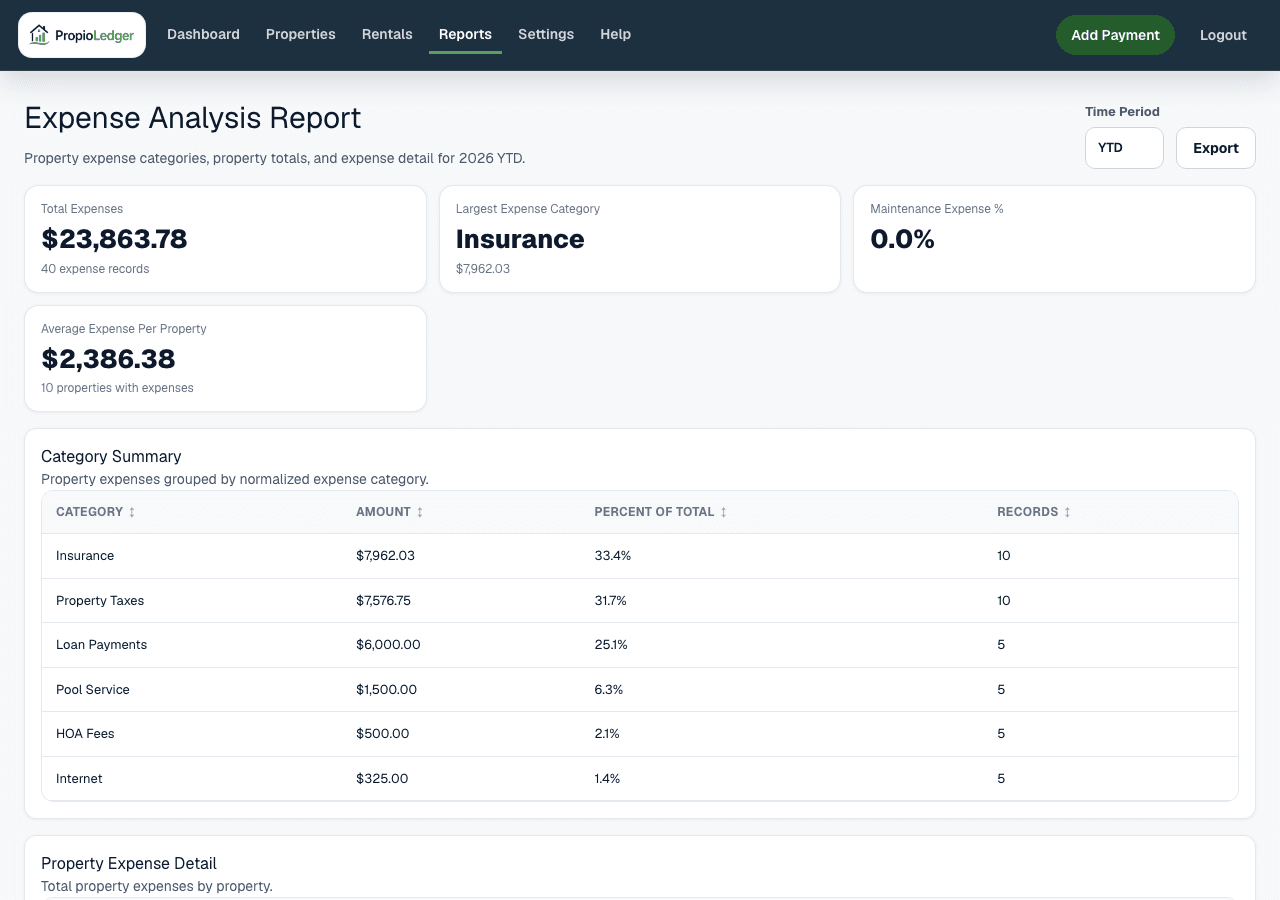
Expense Analysis Report
Analyze posted property expenses by category, property, month, and detail row.
Overview
The Expense Analysis Report helps landlords understand where money is being spent across a rental portfolio. It organizes posted property expenses by category, property, month, and individual detail row.
Use this report when you want to identify the largest expense categories, compare operating costs across properties, review maintenance and repair spending, or research specific expense records.
When To Use It
Income is only one side of rental property performance. The Expense Analysis Report focuses on spending so landlords can monitor costs, identify trends, support budgeting, and improve profitability.
It answers questions such as what the largest expenses are, which properties cost the most to operate, whether maintenance and repairs are increasing, and which individual expense rows support the totals.
Available Date Ranges
- Year To Date.
- Prior calendar years that have posted expense data.
Summary Metrics
Total Expenses is the sum of posted property expense amounts whose paid date falls inside the selected period.
Largest Expense Category is the category row with the highest category total during the selected period.
Maintenance Expense Percent is Maintenance plus Repairs divided by Total Expenses, expressed as a percentage. It is zero when Total Expenses is zero.
Average Expense Per Property is Total Expenses divided by the number of property rows. It is zero when there are no property rows.
Expense Count is the number of posted property expense records included in the report. Property Count is the number of properties represented by those expense records.
Category Summary
The Category Summary section groups posted property expenses by normalized expense category. Each row shows category, amount, percent of total, and record count.
Use this section to identify the largest spending categories and understand which categories have the greatest impact on profitability.
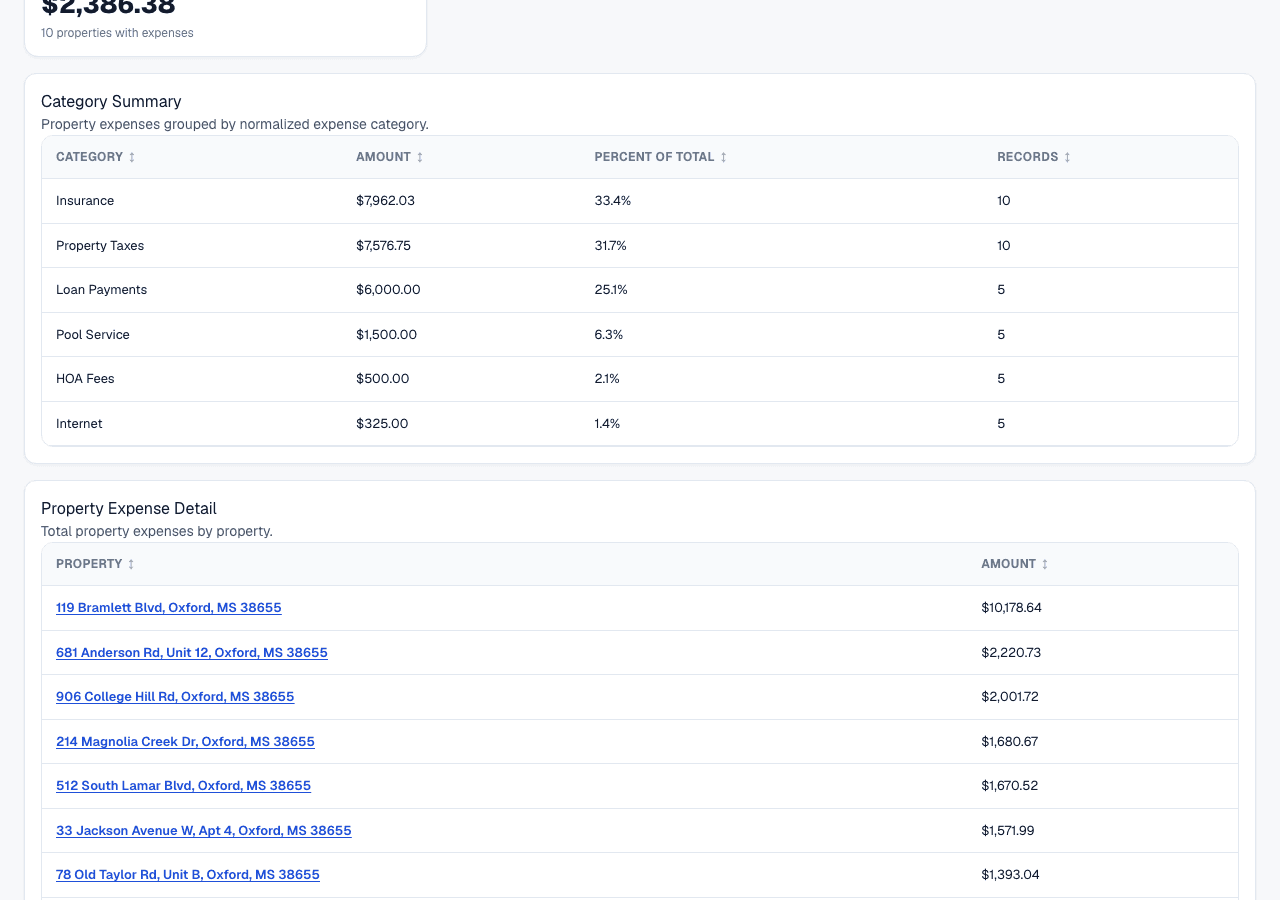
Property Expense Detail
The Property Expense Detail section summarizes total expenses by property for the selected period.
Use it to compare operating costs across properties and identify properties with unusually high expenses.
Monthly Expense Trend
The Monthly Expense Trend section groups posted expenses by paid month.
Use it to spot seasonal expense patterns, large one-time costs, unexpected increases, and longer-term spending trends.
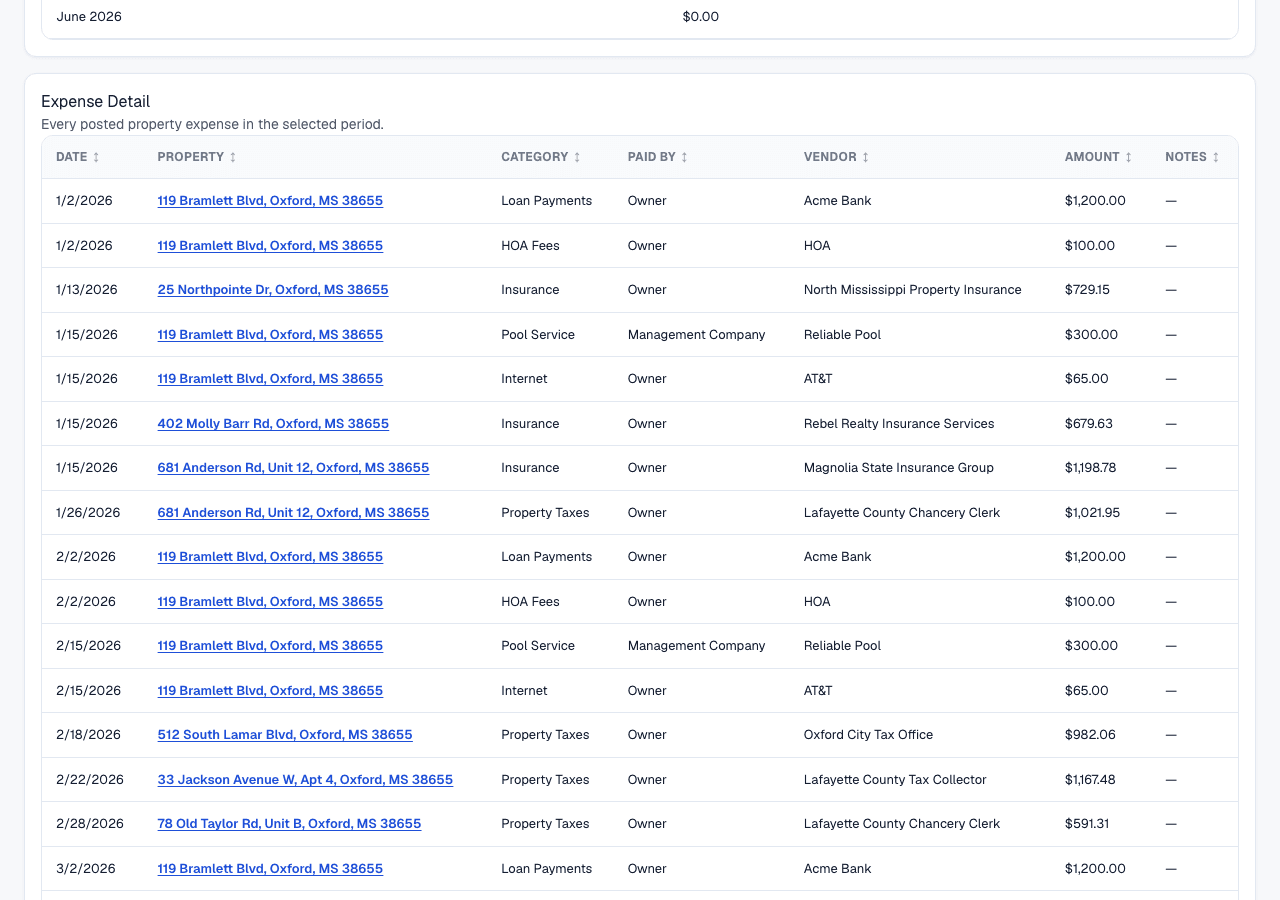
Expense Detail
The Expense Detail section lists every posted property expense in the selected period. Each row includes date, property, category, paid by, vendor, amount, and notes.
Use this section when researching a specific cost, checking a vendor, or reviewing source records before accountant review.
Formula
Total Expenses = sum of posted property expense amounts whose paid date falls inside the selected period.
Category Total = sum of expenses in that category.
Category Percent Of Total = category total / total expenses * 100, or zero when Total Expenses is zero.
Largest Expense Category = category row with the highest Category Total.
Property Total = sum of expenses for that property.
Monthly Expenses = sum of expenses paid in that month.
Maintenance Expense Percent = (Maintenance + Repairs) / Total Expenses * 100, or zero when Total Expenses is zero.
Average Expense Per Property = Total Expenses / property count, or zero when there are no property rows.
Data Sources
The Expense Analysis Report uses posted property expense rows. Expense dates are based on the paid date, not the date the record was created.
Expense categories are normalized property expense types. The report does not use renter ledger charges or payment transactions.
Scheduled recurring expense occurrences are not included until they become posted property expense records.
Included Records
- Posted property expenses whose paid date falls inside the selected period.
- Expense category, property, vendor, paid-by, amount, and notes from posted property expense records.
- Properties represented by posted expense activity in the selected period.
- Expenses visible in the current company scope.
Excluded Records
- Future scheduled recurring expense occurrences that have not been posted.
- Rental ledger charges, because those are renter balance records rather than property expenses.
- Payment transactions, because the report focuses only on spending.
- Property expenses whose paid date falls outside the selected period.
- Expenses outside the current company scope.
Expense Analysis Vs Cashflow
The Expense Analysis Report focuses on spending, categories, trends, and cost drivers.
The Cashflow Report focuses on money in, money out, and net cashflow by month and property. Use Cashflow when you need income and expenses together, and use Expense Analysis when you want a deeper view of costs.
Expense Analysis Vs Accounting
The Expense Analysis Report is optimized for understanding spending patterns and cost drivers.
The Accounting Report is optimized for accountant-ready financial organization, including rental income, other collections, refunds, property expenses, and net operating income.
Common Use Cases
- Identify the largest expense categories in the selected period.
- Compare property operating costs across the portfolio.
- Monitor maintenance and repair spending over time.
- Review monthly expense trends for budgeting.
- Research specific expenses by date, property, vendor, and notes.
Things To Watch For
- Only posted property expenses are included. Scheduled recurring expenses are excluded until posted.
- Paid date controls whether an expense appears in the selected period.
- Consistent expense categorization improves category totals and maintenance percentage accuracy.
- Maintenance Expense Percent only uses categories named Maintenance and Repairs.
- Expense Analysis does not include income, collections, or renter balances.
Export Options
The Expense Analysis Report supports CSV download, Excel download, and printable PDF-style browser export.
Related Guides
Common Questions
- What expenses are included?Posted property expenses whose paid date falls inside the selected period.
- Why is maintenance tracked separately?Maintenance and repairs are often variable cost drivers, so the report highlights their share of total expenses.
- What is Maintenance Expense Percent?It is Maintenance plus Repairs divided by Total Expenses.
- Why review expense trends?Trends help identify seasonal patterns, unexpected increases, and costs that may affect cashflow or profitability.
- How often should landlords review expenses?Many landlords review expenses monthly so category and vendor issues are easier to catch.
Last Updated
June 2026